Aurora
Aurora visibility, location of the auroral oval and current auroral activity conditions of both North and South polar caps.
Aurora visibility, location of the auroral oval and current auroral activity conditions of both North and South polar caps.
30 minute forecast for auroral oval around two polar caps are produced using OVATION-PRIME seasonal aurora forecast model. (description):
(External links to ovation plots open in a new browser window.)
North pole | South pole
Plots of the auroral oval around two polar caps are produced using DMSP satellite particle data, MSP data and superDARN radar data. (project description):
(External links to OVATION plots open in a new browser window.)
STEREO | Space Weather | UV Index
OVATION-PRIME plot images courtesy of Space Weather Prediction Center at National Oceanic and Atmospheric Administration, www.swpc.noaa.gov
OVATION images and data plots courtesy of Auroral Particles and Imagery Group, Space Department of the Johns Hopkins University Applied Physics Laboratory (JHU/APL), sd-www.jhuapl.edu/Aurora/
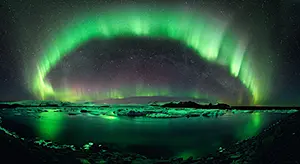
Aurora image taken 2011 over Jökulsárlón, Iceland, credit: Stephane Vetter (Nuits sacrees), www.nuitsacrees.fr